mrdja.sampling.sampling_alligned_parallelogram_2d
- mrdja.sampling.sampling_alligned_parallelogram_2d(n_samples: int, min_x: float, max_x: float, min_y: float, max_y: float, seed: int | None = None) List[Tuple[float, float]][source]
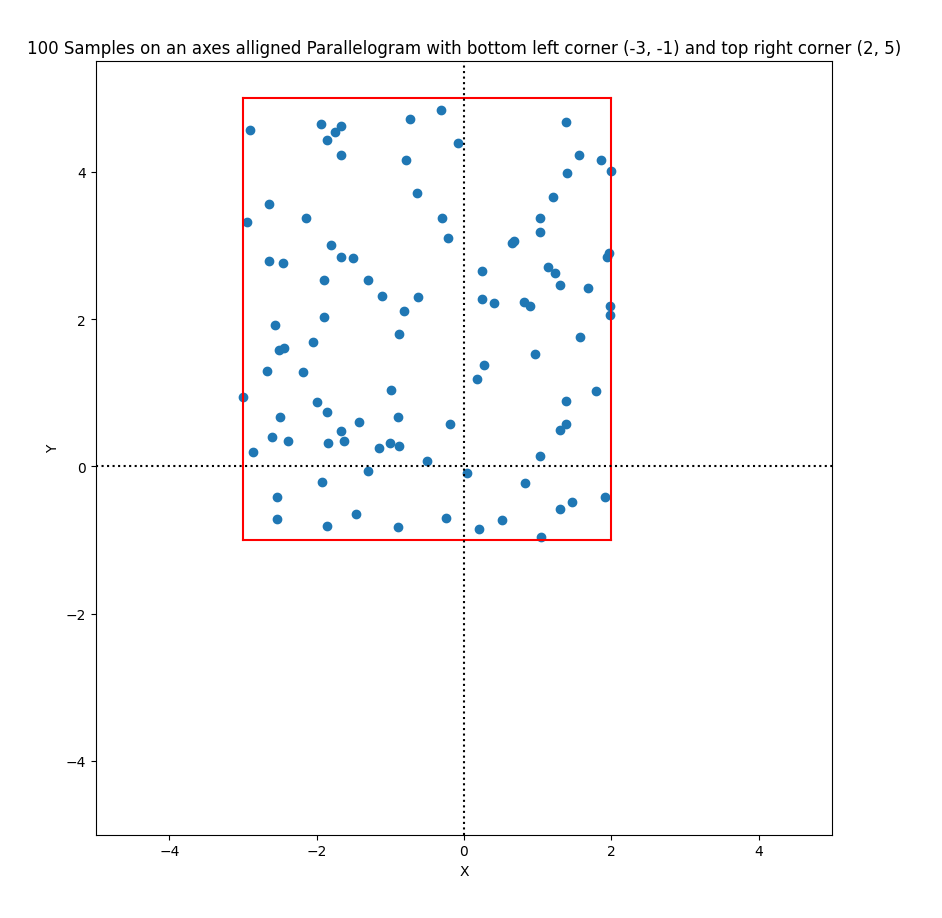
Sample points from a parallelogram with sides parallel to the x and y axes.
- Parameters:
n_samples (int) – The number of samples to generate.
min_x (float) – The minimum x coordinate of the parallelogram.
max_x (float) – The maximum x coordinate of the parallelogram.
min_y (float) – The minimum y coordinate of the parallelogram.
max_y (float) – The maximum y coordinate of the parallelogram.
seed (Optional[int]) – The seed to use for the random number generator.
- Returns:
A list of tuples (x, y) representing the coordinates of the sampled points.
- Return type:
List[Tuple[float, float]]
Note
The samples are uniformly distributed on the parallelogram.
Examples
Sample 100 points from a parallelogram with sides parallel to the x and y axes:
Required imports:
>>> import mrdja.sampling as sampling
>>> import mrdja.geometry as geometry
>>> import matplotlib.pyplot as plt
Define the limits of the parallelogram and the number of points to sample:
>>> n_samples = 100
>>> min_x = -3
>>> max_x = 2
>>> min_y = -1
>>> max_y = 5
Sample the points:
>>> samples = sampling.sampling_alligned_parallelogram_2d(n_samples=n_samples, min_x=min_x,
>>>                                          max_x=max_x, min_y=min_y, max_y=max_y, seed=42)
>>> # list the first 5 samples
>>> samples[:5]
[(0.19713399228941864, -0.8499354686639984),
(-1.6248534081544037, 0.3392644288929365),
(0.6823560708200622, 3.0601969245374683),
(1.460897838524227, -0.4783670042235031),
(-0.8903909015736478, -0.8212166833715779)]
Plot the samples:
>>> fig, ax = plt.subplots()
>>> graph_limits = geometry.get_limits_of_graph_from_limits_of_object(min_x, max_x, min_y, max_y)
>>> ax.set_xlim(graph_limits[0], graph_limits[1])  # Set x-axis limits
>>> ax.set_ylim(graph_limits[2], graph_limits[3]*1.1)  # Set y-axis limits
>>> ax.scatter(*zip(*samples))
>>> ax.set_aspect('equal')
>>> # create title from n_samples, center, and radius, usign fstring
>>> title = (f'{n_samples} Samples on an axes alligned Parallelogram with bottom left corner '
>>>          f'({min_x}, {min_y}) and top right corner ({max_x}, {max_y})'
>>>     )
>>> ax.set_title(title)
>>> # draw also the parallelogram in red
>>> ax.plot([min_x, max_x], [min_y, min_y], color='r')
>>> ax.plot([min_x, max_x], [max_y, max_y], color='r')
>>> ax.plot([min_x, min_x], [min_y, max_y], color='r')
>>> ax.plot([max_x, max_x], [min_y, max_y], color='r')
>>> ax.set_xlabel('X')
>>> ax.set_ylabel('Y')
>>> # Draw the X and Y axes in dotted lines
>>> ax.axhline(0, linestyle='dotted', color='black')
>>> ax.axvline(0, linestyle='dotted', color='black')
>>> plt.show()