mrdja.sampling.sampling_circle_2d
- mrdja.sampling.sampling_circle_2d(n_samples: int = 1, center: Tuple[float, float] = (0, 0), radius: float = 1, seed: int | None = None)[source]
Generate random samples on a 2D circle with a specified radius and center.
- Parameters:
n_samples (int) – The number of random samples to generate on the circle.
center (Tuple[float, float]) – A tuple (x, y) representing the center of the circle. Default is (0,0).
radius (float) – The radius of the circle. Default is 1.
seed (int) – The seed value for the random number generator. Default is None.
- Returns:
A list of tuples (x, y) representing the coordinates of the sampled points.
- Return type:
List[Tuple[float, float]]
Note
The samples are uniformly distributed on the circle.
Examples
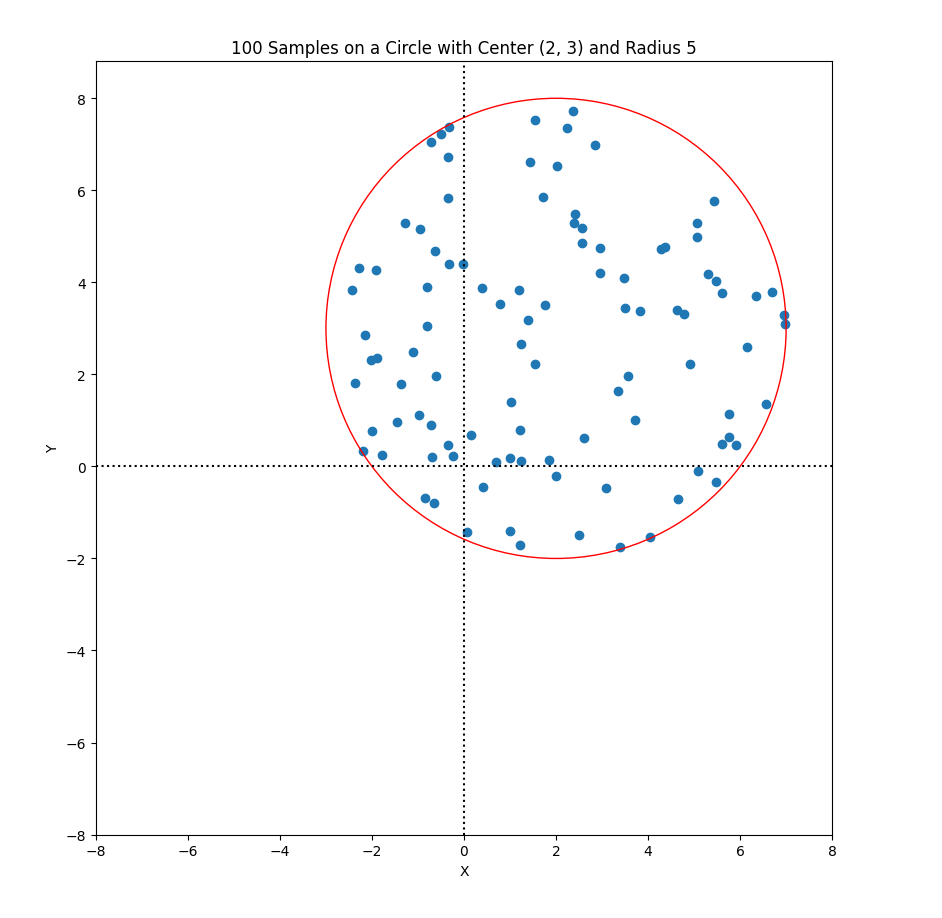
Generate 100 random samples on a circle with center (2,3) and radius 5:
Required imports:
>>> import mrdja.sampling as sampling
>>> import mrdja.geometry as geometry
>>> import matplotlib.pyplot as plt
Define the limits of the parallelogram and the number of points to sample:
>>> n_samples = 100
>>> center = (2,3)
>>> radius = 5
Generate the samples:
>>> samples = sampling.sampling_circle_2d(n_samples=100, center=center, radius=radius, seed=42)
>>> # list the first 5 samples
>>> samples[:5]
[(3.3942679845788373, -1.7498924477733304),
(-0.24970681630880742, 0.23210738148822774),
(4.364712141640124, 4.766994874229113),
(1.2192181968527043, -1.7020278056192968),
(-0.8136202519639664, 3.0535528810336237)]
Plot the samples:
>>> fig, ax = plt.subplots()
>>> xlim_min = center[0] - radius
>>> xlim_max = center[0] + radius
>>> ylim_min = center[1] - radius
>>> ylim_max = center[1] + radius
>>> graph_limits = geometry.get_limits_of_graph_from_limits_of_object(xlim_min, xlim_max, ylim_min, ylim_max)
>>> ax.set_xlim(graph_limits[0], graph_limits[1])  # Set x-axis limits
>>> ax.set_ylim(graph_limits[2], graph_limits[3]*1.1)  # Set y-axis limits
>>> ax.scatter(*zip(*samples))
>>> ax.set_aspect('equal')
>>> # create title from n_samples, center, and radius, using f-string
>>> title = (f'{n_samples} Samples on a Circle with Center {center} and Radius {radius}')
>>> ax.set_title(title)
>>> # draw also the circle in red
>>> circle = plt.Circle(center, radius, color='r', fill=False)
>>> ax.add_artist(circle)
>>> # draw the X and Y axes in dotted lines
>>> ax.axhline(0, linestyle='dotted', color='black')
>>> ax.axvline(0, linestyle='dotted', color='black')
>>> ax.set_xlabel('X')
>>> ax.set_ylabel('Y')
>>> plt.show()