mrdja.sampling.sampling_circle_3d
- mrdja.sampling.sampling_circle_3d(n_samples, radius: float = 1.0, center: ndarray = array([0, 0, 0]), normal: ndarray = array([0, 0, 1]), seed: int | None = None) List[ndarray][source]
Sample a n_samples number of points from a 3D circle using the rejection sampling method.
- Parameters:
n_samples (int) – The number of samples to generate.
radius (float) – The radius of the circle.
center (np.ndarray) – The center of the circle.
normal (np.ndarray) – The normal vector of the plane on which the circle lies.
- Returns:
A list of tuples (x, y, z) representing the coordinates of the sampled points.
- Return type:
List[Tuple[float, float, float]]
Note
The samples are uniformly distributed on the circle.
- Example:
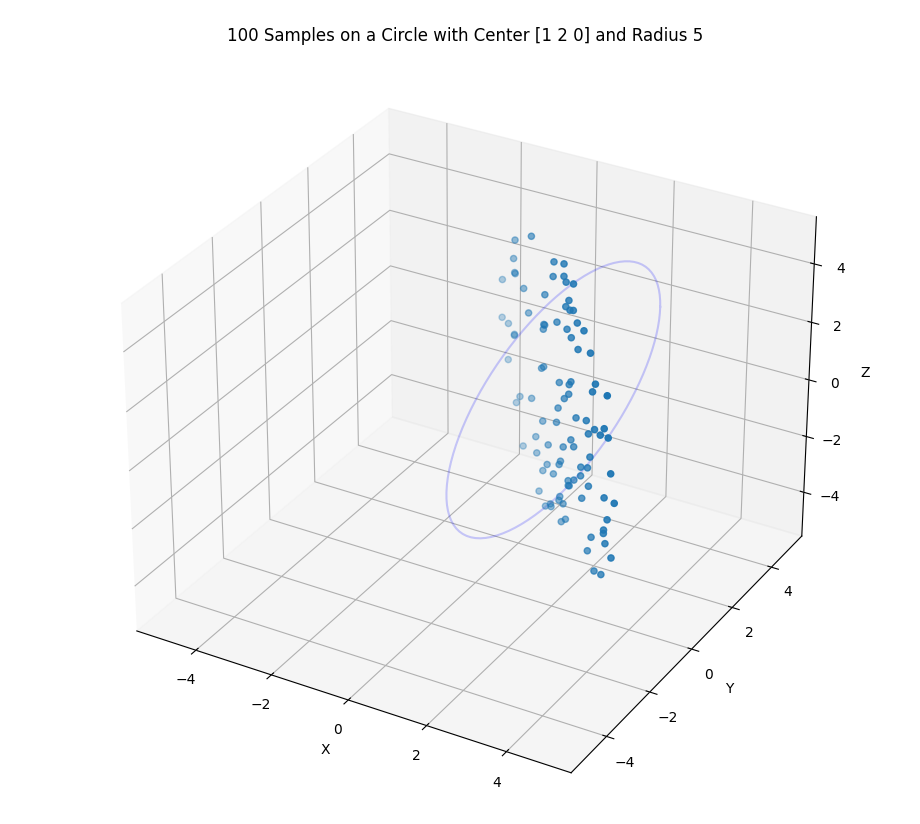
Sample 100 points from a circle in an arbitrary position and with arbitrary normal vector:
Required imports:
>>> import mrdja.sampling as sampling
>>> import mrdja.geometry as geom
>>> import mrdja.matplot3d as plt3d
>>> import matplotlib.pyplot as plt
>>> import numpy as np
Define the parameters of the circle and the number of points to sample:
>>> n_samples = 100
>>> radius = 5
>>> center = np.array([1, 2, 0])
>>> normal = np.array([1, 1, 0]) / np.linalg.norm(np.array([1, 1, 0]))
Sample the points:
>>> samples = sampling.sampling_circle_3d(n_samples=n_samples, radius=radius, center=center, normal=normal, seed=42)
>>> # list the first 5 samples
>>> samples[:5]
[array([ 4.07208022, -1.07208022, -2.24970682]),
array([-1.56630238,  4.56630238,  1.76699487]),
array([0.05579622, 2.94420378, 0.05355288]),
array([0.13849159, 2.86150841, 1.49884438]),
array([2.62250429, 0.37749571, 0.89265684])]
Plot the 3D circle and the samples:
>>> fig = plt.figure()
>>> ax = fig.add_subplot(111, projection='3d')
>>> plt3d.draw_circumference(center=center, radius=radius, normal=normal, color="blue", alpha=0.2, ax=ax)
>>> xlim_min = np.min([sample[0] for sample in samples])
>>> xlim_max = np.max([sample[0] for sample in samples])
>>> ylim_min = np.min([sample[1] for sample in samples])
>>> ylim_max = np.max([sample[1] for sample in samples])
>>> zlim_min = np.min([sample[2] for sample in samples])
>>> zlim_max = np.max([sample[2] for sample in samples])
>>> graph_limits = geom.get_limits_of_3d_graph_from_limits_of_object(xlim_min, xlim_max, ylim_min, ylim_max, zlim_min, zlim_max)
>>> ax.set_xlim(graph_limits[0], graph_limits[1])  # Set x-axis limits
>>> ax.set_ylim(graph_limits[2], graph_limits[3])  # Set y-axis limits
>>> ax.set_zlim(graph_limits[4], graph_limits[5])  # Set z-axis limits
>>> ax.scatter(*zip(*samples))
>>> # create title from n_samples, center, and radius, using f-string
>>> title = (f'{n_samples} Samples on a Circle with Center {center} and Radius {radius}')
>>> ax.set_title(title)
>>> ax.set_xlabel('X')
>>> ax.set_ylabel('Y')
>>> ax.set_zlabel('Z')
>>> plt.show()