mrdja.sampling.sampling_parallelepiped_3d
- mrdja.sampling.sampling_parallelepiped_3d(n_samples: int, normal1: Tuple[float, float, float], normal2: Tuple[float, float, float], normal3: Tuple[float, float, float], center: Tuple[float, float, float], length1: float, length2: float, length3: float, seed: int | None = None) List[Tuple[float, float, float]][source]
Sample n_samples points from a parallelepiped
The parallelogram is defined by the vectors normal1, normal2 and normal3, the center and the lengths of the sides.
- Parameters:
n_samples (int) – The number of samples to generate.
normal1 (Tuple[float, float, float]) – The first vector normal to the sides of the parallelepiped.
normal2 (Tuple[float, float, float]) – The second vector normal to the sides of the parallelepiped.
normal3 (Tuple[float, float, float]) – The third vector normal to the sides of the parallelepiped.
center (Tuple[float, float, float]) – The center of the parallelepiped.
length1 (float) – The length of the first side of the parallelepiped.
length2 (float) – The length of the second side of the parallelepiped.
length3 (float) – The length of the third side of the parallelepiped.
seed (Optional[int]) – The seed to use for the random number generator.
- Returns:
A list of tuples (x, y, z) representing the coordinates of the sampled points.
- Return type:
List[Tuple[float, float, float]]
Note
The samples are uniformly distributed on the parallelepiped.
Examples
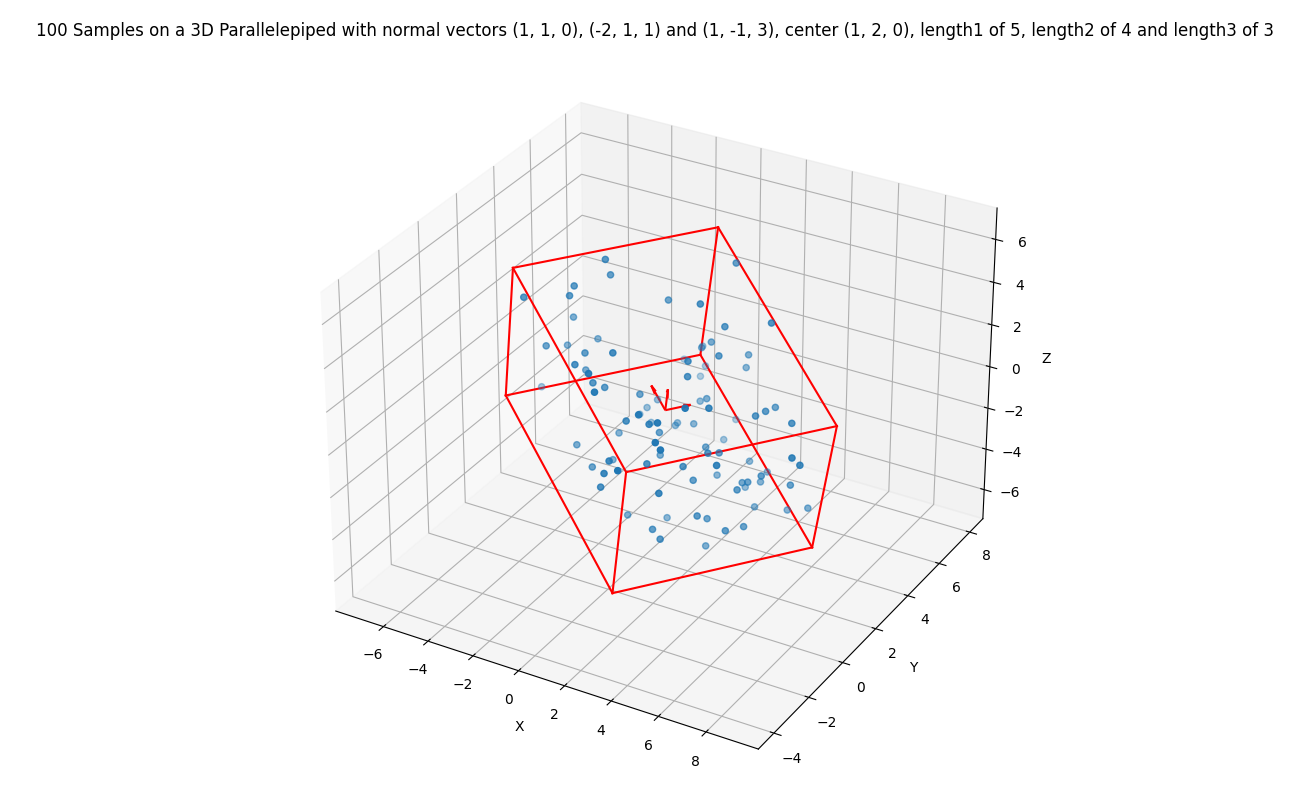
Sample 100 points from a parallelepiped in an arbitrary position and with arbitrary sides:
Required imports:
>>> import mrdja.sampling as sampling
>>> import mrdja.geometry as geometry
>>> import matplotlib.pyplot as plt
>>> import numpy as np
Define the parameters of the parallelepiped and the number of points to sample:
>>> n_samples = 100
>>> normal1 = (1, 1, 0)
>>> normal2 = (-2, 1, 1)
>>> normal3 = (1, -1, 3)
>>> center = (1, 2, 0)
>>> length1 = 5
>>> length2 = 4
>>> length3 = 3
Sample the points:
>>> samples = sampling.sampling_parallelepiped_3d(n_samples=n_samples, normal1=normal1, normal2=normal2,
...                                              normal3=normal3, center=center, length1=length1,
...                                              length2=length2, length3=length3, seed=42)
>>> # list the first 5 samples
>>> samples[:5]
[array([ 4.82213591,  1.47208906, -3.92469311]),
array([-1.74561756,  1.03184009,  2.53618024]),
array([ 6.03115264,  2.54288771, -2.35494829]),
array([ 0.91594816, -1.49252787, -1.07725051]),
array([ 1.49163196, -2.02162286,  0.14431054])]
Plot the 3D parallelepiped and the samples:
>>> samples = np.array(samples)
>>> fig = plt.figure()
>>> ax = fig.add_subplot(111, projection='3d')
>>> ax.scatter(samples[:, 0], samples[:, 1], samples[:, 2])
>>> # create title from n_samples, center, and radius, using fstring
>>> title = (f'{n_samples} Samples on a 3D Parallelepiped with normal vectors {normal1}, {normal2} and {normal3}, '
>>>         f'center {center}, length1 of {length1}, length2 of {length2} and length3 of {length3}')
>>> ax.set_title(title)
>>> # Draw the parallelepiped
>>> vertices = geometry.get_parallelepiped_3d_vertices(center, normal1, normal2, normal3, length1, length2, length3)
>>> # Define the edges of the 3d parallelepiped
>>> edges = [(0, 1), (1, 2), (2, 3), (3, 0), (4, 5), (5, 6),
>>>         (6, 7), (7, 4), (0, 4), (1, 5), (2, 6), (3, 7)]
>>> # Plot the edges
>>> for edge in edges:
>>>     ax.plot([vertices[edge[0]][0], vertices[edge[1]][0]],
>>>         [vertices[edge[0]][1], vertices[edge[1]][1]],
>>>         [vertices[edge[0]][2], vertices[edge[1]][2]], color='red')
>>> # Draw the normals at a quarter of their corresponding length
>>> quarter_length1 = length1 / 4
>>> quarter_length2 = length2 / 4
>>> arrow_length1 = quarter_length1 / 2
>>> arrow_length2 = quarter_length2 / 2
>>> ax.quiver(center[0], center[1], center[2], normal1[0], normal1[1], normal1[2], length=arrow_length1, normalize=False, color='red')
>>> ax.quiver(center[0], center[1], center[2], normal2[0], normal2[1], normal2[2], length=arrow_length2, normalize=False, color='red')
>>> ax.quiver(center[0], center[1], center[2], normal3[0], normal3[1], normal3[2], length=arrow_length2, normalize=False, color='red')
>>> ax.set_xlabel('X')
>>> ax.set_ylabel('Y')
>>> ax.set_zlabel('Z')
>>> plt.show()