mrdja.sampling.sampling_sphere
- mrdja.sampling.sampling_sphere(n_samples: int = 1, center: Tuple[float, float, float] = (0, 0, 0), radius: float = 1, seed: int | None = None) List[Tuple[float, float, float]][source]
Generate random samples on a sphere with a specified radius and center.
- Parameters:
n_samples (int) – The number of random samples to generate on the circle.
center (Tuple[float, float, float]) – A tuple (x, y, z) representing the center of the circle. Default is (0,0).
radius (float) – The radius of the circle. Default is 1.
seed (Optional[int]) – The seed value for the random number generator. Default is None.
- Returns:
A list of tuples (x, y, z) representing the coordinates of the sampled points.
- Return type:
List[Tuple[float, float, float]]
Note
The samples are uniformly distributed on the sphere.
Examples
Sample 100 points from a sphere:
Required imports:
>>> import mrdja.sampling as sampling
>>> import mrdja.geometry as geometry
>>> import matplotlib.pyplot as plt
>>> import numpy as np
Define the parameters of the sphere and the number of points to sample:
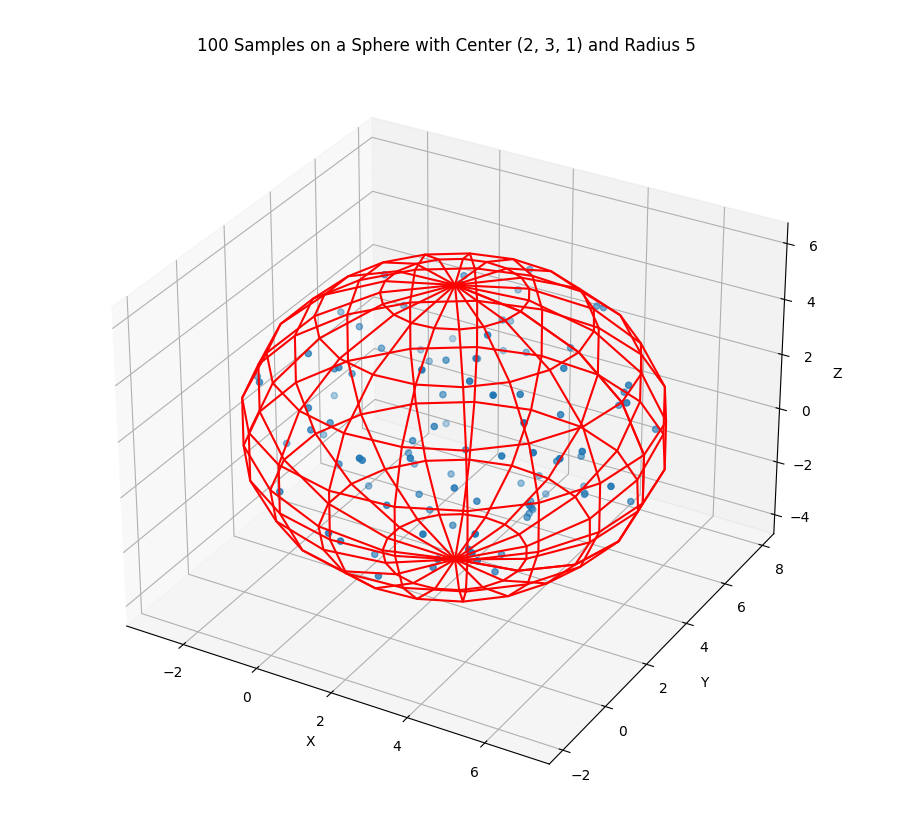
>>> n_samples = 100
>>> center = (2, 3, 1)
>>> radius = 5
Sample the points:
>>> samples = sampling.sampling_sphere(n_samples=n_samples, center=center, radius=radius, seed=42)
>>> # list the first 5 samples
>>> samples[:5]
[(-0.7678926185117723, 5.364712141640124, 2.766994874229113),
(2.4494148060321668, 0.204406220406967, 1.8926568387590872),
(3.9813939498822686, 1.4025051651799187, -2.4452050018821847),
(5.071282732743802, 5.297317866938179, 1.3622809145470074),
(6.731157639793706, 1.7853437720835348, 1.52040631273227)]
Plot the samples:
>>> samples = np.array(samples)
>>> fig = plt.figure()
>>> ax = fig.add_subplot(111, projection='3d')
>>> ax.scatter(samples[:, 0], samples[:, 1], samples[:, 2])
>>> # plot the sphere
>>> u, v = np.mgrid[0:2*np.pi:20j, 0:np.pi:10j]
>>> x = radius*np.cos(u)*np.sin(v) + center[0]
>>> y = radius*np.sin(u)*np.sin(v) + center[1]
>>> z = radius*np.cos(v) + center[2]
>>> ax.plot_wireframe(x, y, z, color="r")
>>> title = f'{n_samples} Samples on a Sphere with Center ({center[0]}, {center[1]}, {center[2]}) and Radius {radius}'
>>> ax.set_title(title)
>>> ax.set_xlabel('X')
>>> ax.set_ylabel('Y')
>>> ax.set_zlabel('Z')
>>> plt.show()