mrdja.sampling.sampling_parallelogram_3d
- mrdja.sampling.sampling_parallelogram_3d(n_samples: int, normal1: Tuple[float, float, float], normal2: Tuple[float, float, float], center: Tuple[float, float, float], length1: float, length2: float, seed: int | None = None) List[Tuple[float, float, float]][source]
Sample n_samples points from a parallelogram
The parallelogram is defined by the vectors normal1 and normal2, the center and the lengths of the sides.
- Parameters:
n_samples (int) – The number of samples to generate.
normal1 (Tuple[float, float, float]) – The first vector normal to the sides of the parallelepiped.
normal2 (Tuple[float, float, float]) – The second vector normal to the sides of the parallelepiped.
center (Tuple[float, float, float]) – The center of the parallelepiped.
length1 (float) – The length of the first side of the parallelepiped.
length2 (float) – The length of the second side of the parallelepiped.
seed (Optional[int]) – The seed to use for the random number generator.
- Returns:
A list of tuples (x, y, z) representing the coordinates of the sampled points.
- Return type:
List[Tuple[float, float, float]]
Note
The samples are uniformly distributed on the parallelogram.
Examples
Sample 100 points from a parallelogram in an arbitrary position and with arbitrary sides:
Required imports:
>>> import mrdja.sampling as sampling
>>> import mrdja.geometry as geometry
>>> import matplotlib.pyplot as plt
>>> import numpy as np
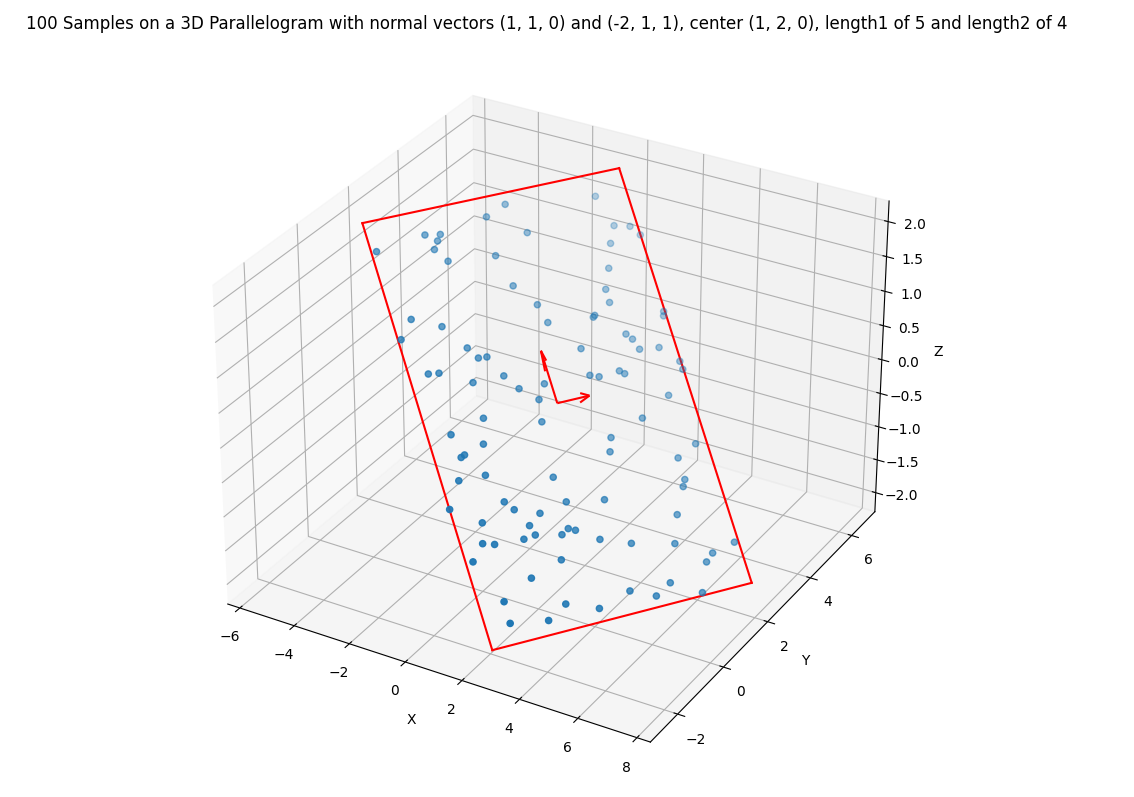
Define the parameters of the parallelogram and the number of points to sample:
>>> n_samples = 100
>>> normal1 = (1, 1, 0)
>>> normal2 = (-2, 1, 1)
>>> center = (1, 2, 0)
>>> length1 = 5
>>> length2 = 4
Sample the points:
>>> samples = sampling.sampling_parallelogram_3d(n_samples=n_samples, normal1=normal1, normal2=normal2,
...                                              center=center, length1=length1, length2=length2, seed=42)
>>> # list the first 5 samples
>>> samples[:5]
[array([ 5.49704795,  0.79717701, -1.89995698]),
array([ 2.08946069, -0.23201046, -1.10715705]),
array([0.76876017, 3.88915402, 0.70679795]),
array([ 6.26538718,  2.30865317, -1.65224467]),
array([ 4.37123134, -0.27120202, -1.88081112])]
Plot the 3D parallelogram and the samples:
>>> samples = np.array(samples)
>>> fig = plt.figure()
>>> ax = fig.add_subplot(111, projection='3d')
>>> ax.scatter(samples[:, 0], samples[:, 1], samples[:, 2])
>>> # create title from n_samples, center, and radius, using fstring
>>> title = (f'{n_samples} Samples on a 3D Parallelogram with normal vectors {normal1} and {normal2}, '
>>>         f'center {center}, length1 of {length1} and length2 of {length2}')
>>> ax.set_title(title)
>>> # Draw the parallelogram
>>> vertices = geometry.get_parallelogram_3d_vertices(center, normal1, normal2, length1, length2)
>>> # Define the edges of the 3d parallelogram
>>> edges = [(0, 1), (1, 2), (2, 3), (3, 0)]
>>> # Plot the edges
>>> for edge in edges:
>>>     ax.plot([vertices[edge[0]][0], vertices[edge[1]][0]],
>>>         [vertices[edge[0]][1], vertices[edge[1]][1]],
>>>         [vertices[edge[0]][2], vertices[edge[1]][2]], color='red')
>>> # Draw the normals at a quarter of their corresponding length
>>> quarter_length1 = length1 / 4
>>> quarter_length2 = length2 / 4
>>> arrow_length1 = quarter_length1 / 2
>>> arrow_length2 = quarter_length2 / 2
>>> ax.quiver(center[0], center[1], center[2], normal1[0], normal1[1], normal1[2], length=arrow_length1, normalize=False, color='red')
>>> ax.quiver(center[0], center[1], center[2], normal2[0], normal2[1], normal2[2], length=arrow_length2, normalize=False, color='red')
>>> ax.set_xlabel('X')
>>> ax.set_ylabel('Y')
>>> ax.set_zlabel('Z')
>>> plt.show()