mrdja.sampling.sampling_parallelogram_2d
- mrdja.sampling.sampling_parallelogram_2d(n_samples: int, normal1: Tuple[float, float], normal2: Tuple[float, float], center: Tuple[float, float], length1: float, length2: float, seed: int | None = None) List[Tuple[float, float]][source]
Sample a n_samples number of points from a 2D parallelogram.
The parallelogram has sides parallel to the vectors normal1 and normal2, with lengths length1 and length2 respectively, and centered at center.
- Parameters:
n_samples (int) – The number of samples to generate.
normal1 (Tuple[float, float]) – The first vector normal to the sides of the parallelogram.
normal2 (Tuple[float, float]) – The second vector normal to the sides of the parallelogram.
center (Tuple[float, float]) – The center of the parallelogram.
length1 (float) – The length of the first side of the parallelogram.
length2 (float) – The length of the second side of the parallelogram.
- Returns:
A list of tuples (x, y) representing the coordinates of the sampled points.
- Return type:
List[Tuple[float, float]]
Note
The samples are uniformly distributed on the parallelogram.
Examples
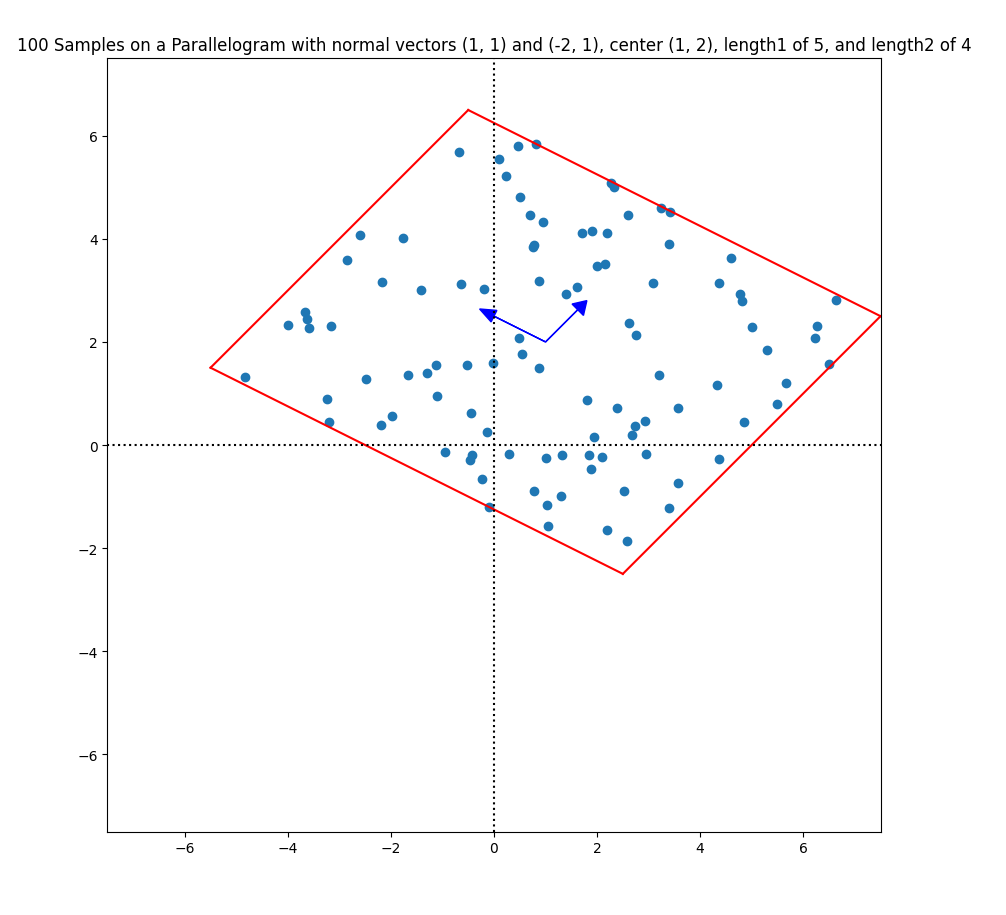
Sample 100 points from a parallelogram in an arbitrary position and with arbitrary sides:
Required imports:
>>> import mrdja.sampling as sampling
>>> import mrdja.geometry as geometry
>>> import matplotlib.pyplot as plt
>>> import numpy as np
Define the parameters of the parallelogram and the number of points to sample:
>>> n_samples = 100
>>> normal1 = (1, 1)
>>> normal2 = (-2, 1)
>>> center = (1, 2)
>>> length1 = 5
>>> length2 = 4
Sample the points:
>>> samples = sampling.sampling_parallelogram_2d(n_samples=n_samples, normal1=normal1, normal2=normal2,
                                            center=center, length1=length1, length2=length2, seed=42)
>>> # list the first 5 samples
>>> samples[:5]
[(5.497047950508083, 0.7971770131800864),
(2.0894606866550145, -0.23201045555911293),
(0.7687601714367718, 3.8891540205117074),
(6.265387177488898, 2.3086531690418917),
(4.3712313429217895, -0.2712020238213664)]
Plot the samples:
>>> fig, ax = plt.subplots()
>>> ax.scatter(*zip(*samples))
>>> ax.set_aspect('equal')
>>> center = np.array(center)
>>> normal1 = np.array(normal1)
>>> normal2 = np.array(normal2)
>>> vertex1 = center + normal1 * length1 / 2 + normal2 * length2 / 2
>>> vertex2 = center - normal1 * length1 / 2 + normal2 * length2 / 2
>>> vertex3 = center - normal1 * length1 / 2 - normal2 * length2 / 2
>>> vertex4 = center + normal1 * length1 / 2 - normal2 * length2 / 2
>>> xlim_min = min(vertex1[0], vertex2[0], vertex3[0], vertex4[0])
>>> xlim_max = max(vertex1[0], vertex2[0], vertex3[0], vertex4[0])
>>> ylim_min = min(vertex1[1], vertex2[1], vertex3[1], vertex4[1])
>>> ylim_max = max(vertex1[1], vertex2[1], vertex3[1], vertex4[1])
>>> graph_limits = geometry.get_limits_of_graph_from_limits_of_object(xlim_min, xlim_max, ylim_min, ylim_max)
>>> ax.set_xlim(graph_limits[0], graph_limits[1])  # Set x-axis limits
>>> ax.set_ylim(graph_limits[2], graph_limits[3])  # Set y-axis limits
>>> # create title from n_samples, center, and radius, using f-string
>>> title = (f'{n_samples} Samples on a Parallelogram with normal vectors ({normal1[0]}, {normal1[1]}) '
>>>         f'and ({normal2[0]}, {normal2[1]}), center ({center[0]}, {center[1]}), length1 of {length1}, '
>>>         f'and length2 of {length2}'
>>>          )
>>> ax.set_title(title)
>>> # draw also the parallelogram in red
>>> vertices = geometry.get_parallelogram_2d_vertices(center, normal1, normal2, length1, length2)
>>> ax.plot([vertices[0][0], vertices[1][0]], [vertices[0][1], vertices[1][1]], color='r')
>>> ax.plot([vertices[1][0], vertices[2][0]], [vertices[1][1], vertices[2][1]], color='r')
>>> ax.plot([vertices[2][0], vertices[3][0]], [vertices[2][1], vertices[3][1]], color='r')
>>> ax.plot([vertices[3][0], vertices[0][0]], [vertices[3][1], vertices[0][1]], color='r')
>>> # Draw the X and Y axes in dotted lines
>>> ax.axhline(0, linestyle='dotted', color='black')
>>> ax.axvline(0, linestyle='dotted', color='black')
>>> # Draw the normals at a quarter of their corresponding length
>>> quarter_length1 = length1 / 8
>>> quarter_length2 = length2 / 8
>>> arrow_length1 = quarter_length1 / 2
>>> arrow_length2 = quarter_length2 / 2
>>> ax.arrow(center[0], center[1], normal1[0] * quarter_length1, normal1[1] * quarter_length1,
>>>         head_width=arrow_length1, head_length=arrow_length2, fc='b', ec='b')
>>> ax.arrow(center[0], center[1], normal2[0] * quarter_length2, normal2[1] * quarter_length2,
>>>         head_width=arrow_length2, head_length=arrow_length1, fc='b', ec='b')
>>> plt.show()